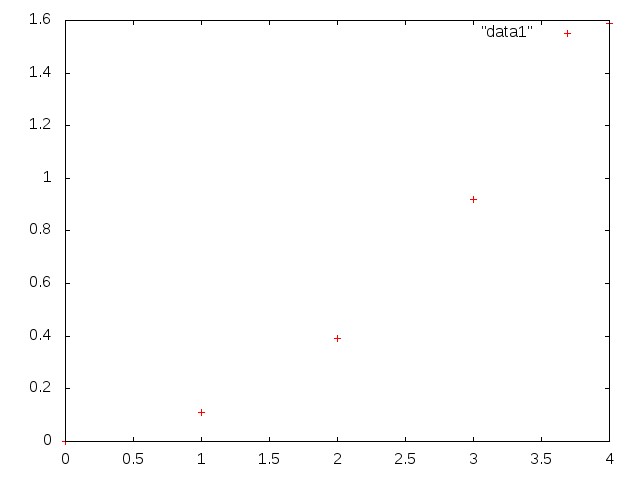
plot "data1"
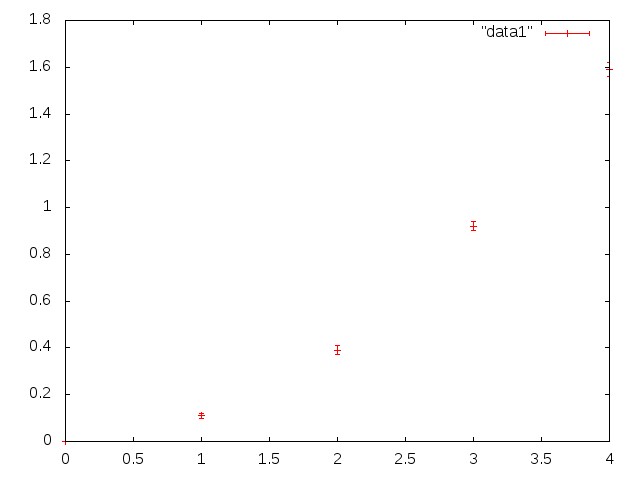
plot "data1" with errorbars
Some of the parts of the command may be shortened:
p "data1" w errorbars
is equivalent.
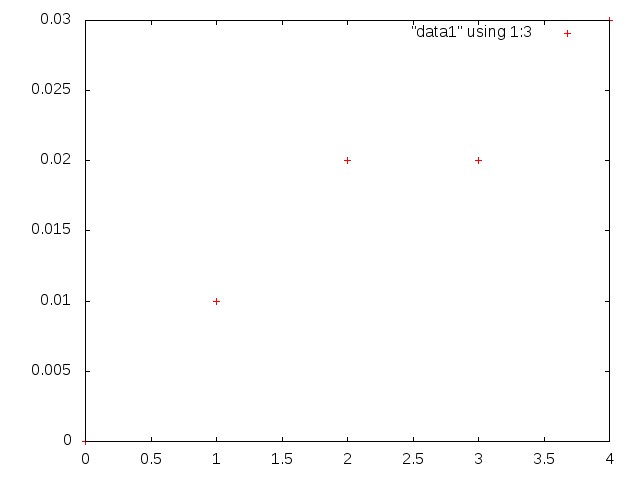
p "data1" using 1:3
or
p "data1" u 1:3
is equivalent.
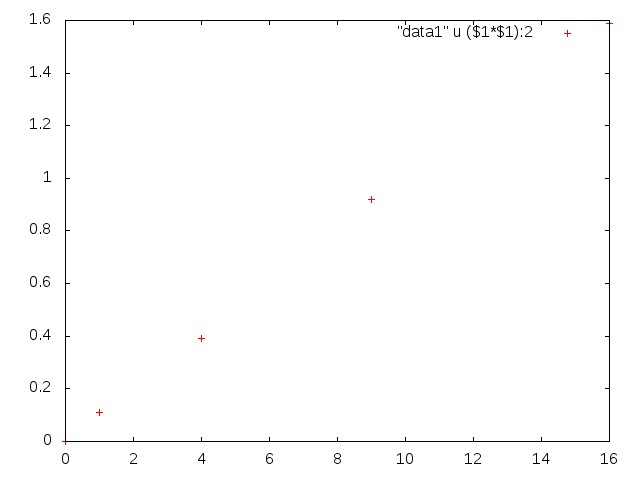
p "data1" u ($1*$1):2
will plot the second column as a function of the square of the first column.
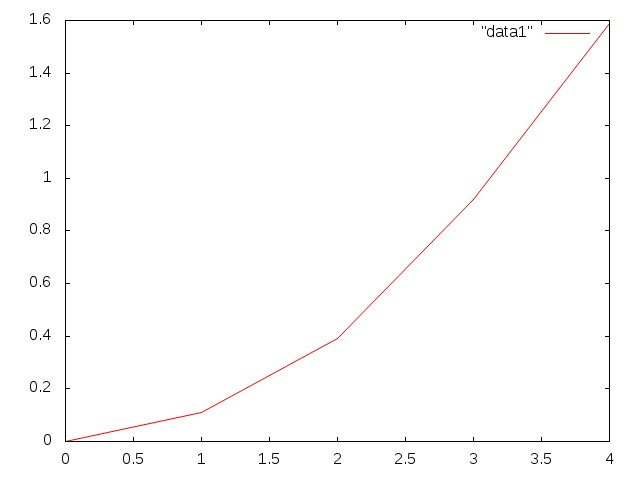
p "data1" with lines
or
p "data1" w l
is equivalent.
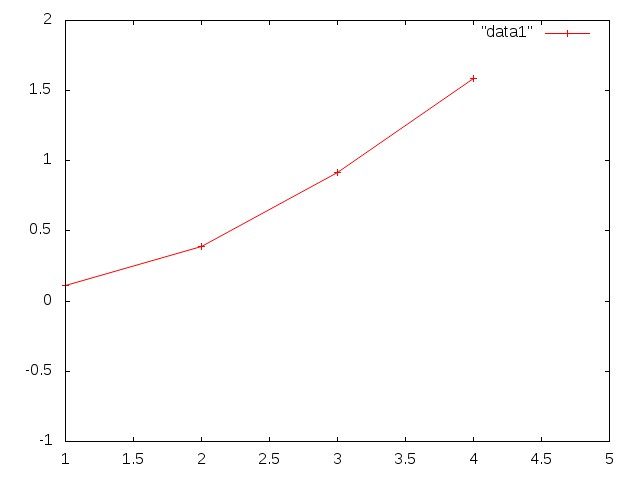
p [1:5][-1:] "data1" with linepoints
or
p [1:5][-1:] "data1" w lp
is equivalent.
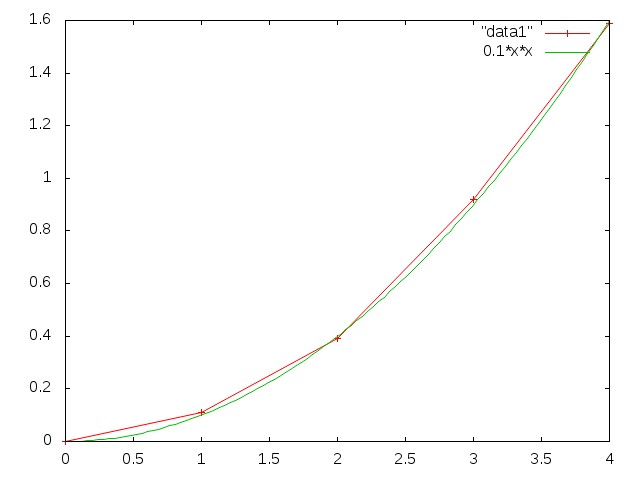
p "data1" w lp , 0.1*x*x
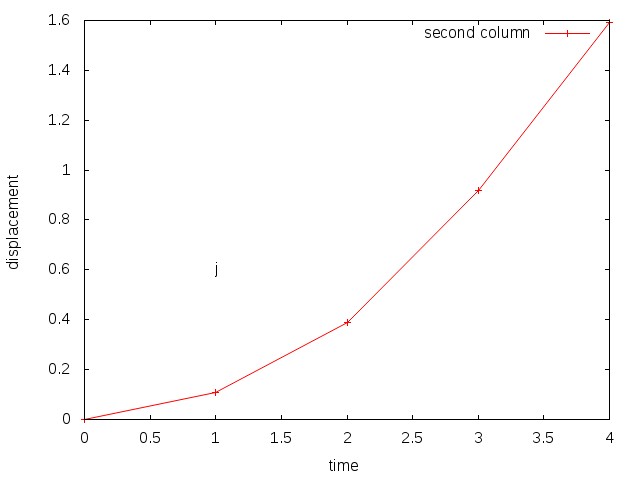
set label "j" at 1,0.6
set xlabel "time"
set ylabel "displacement"
p "data1" w lp title "second column"
When you have to enter this many commands to generate a plot, it becomes more practical to put these commands into a file, and then load them in gnuplot. For example, create a file named Figure1.gp with the following contents:
set label "j" at 1,0.6 set xlabel "time" set ylabel "displacement" p "data1" w lp title "second column"and then just enter
load "Figure1.gp"
in gnuplot. This way, you will not have to re-write all commands when you want to make adjustments to the figure.